
Loop XXI Research · Bitcoin lab
A curve is not
a certainty.
Explore Bitcoin's long-term shape without mistaking an elegant model for a promise. Change the assumptions. Watch the path move. Keep the evidence separate.
Motion study / 001
Growth can rise
and slow at once.
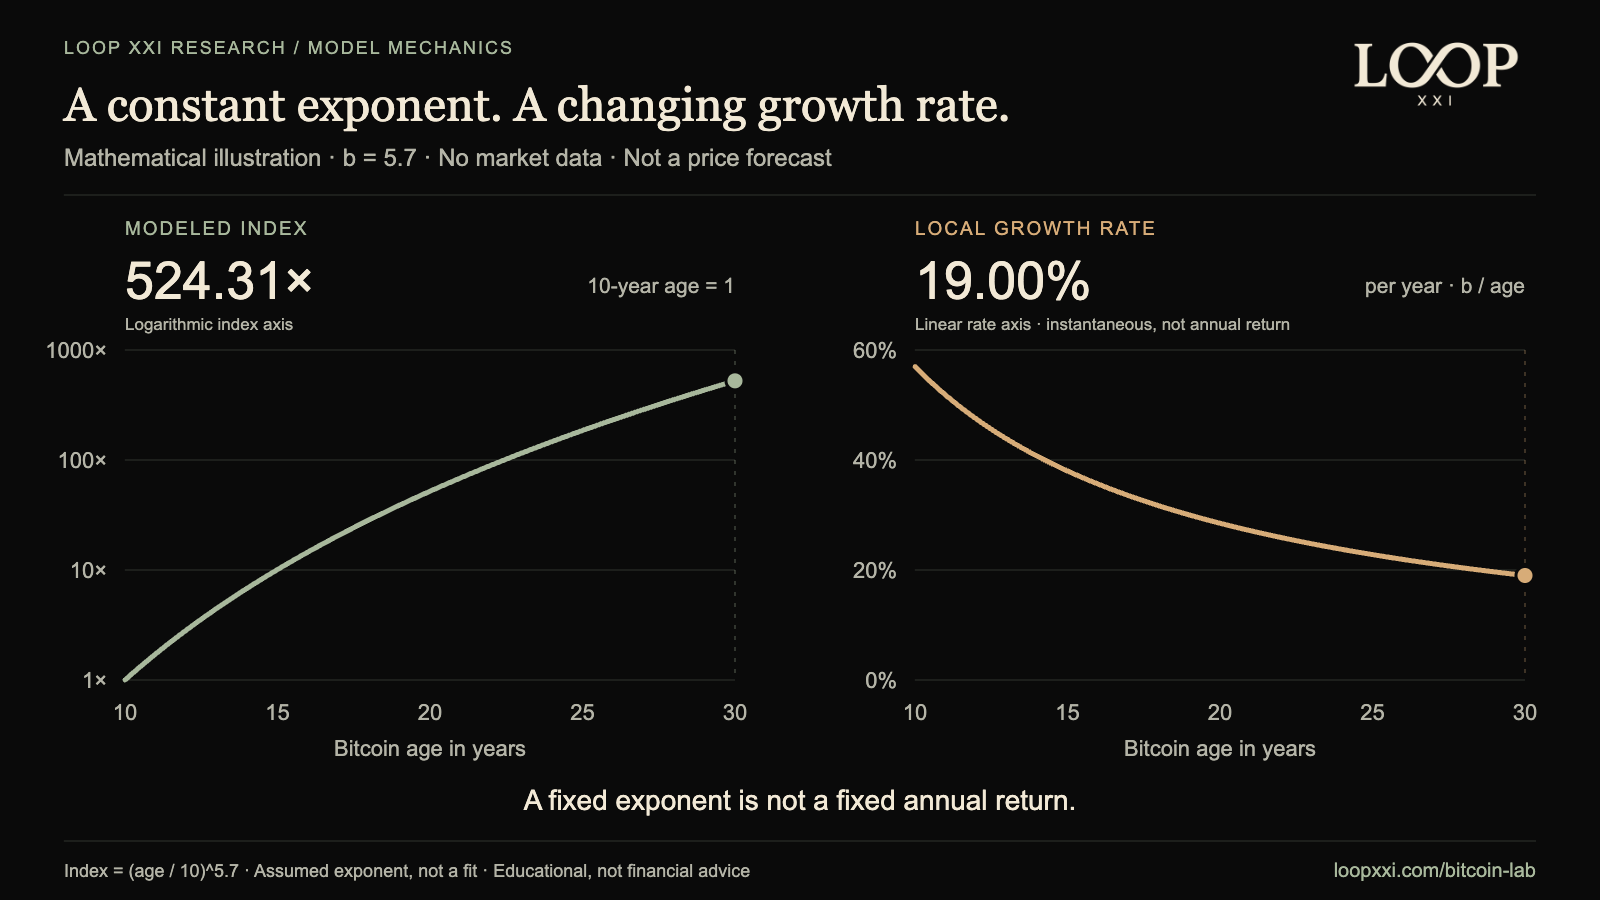
A fixed power-law exponent does not mean a fixed annual return. Move through Bitcoin age to see the index rise while its local proportional growth slows. This is mathematics, not market data.
21 seconds. No autoplay. Pause or use the slider at any time.
On a small screen, swipe the chart horizontally or open the full-size chart. Exact values are in the table below.
Index = (age / 10)^5.7; index is one at age ten. Local growth = 5.7 / age, measured per year. Left axis is logarithmic; right axis is linear. This local rate is not a finite annual return. Neither panel is a forecast or a fitted historical model.
Exact values, downloads and attribution
| Bitcoin age (years) | Index (age 10 = 1) | Local proportional rate (% / year) |
|---|---|---|
| 10 | 1.00 | 57.00 |
| 15 | 10.09 | 38.00 |
| 20 | 51.98 | 28.50 |
| 25 | 185.46 | 22.80 |
| 30 | 524.31 | 19.00 |
Math: the derivative of a power law; Bitcoin-age context from the Scientific Bitcoin Institute. Exponent chosen for illustration, not estimated here. Original composition, code and animation by Loop XXI. No third-party chart was copied.
01 / Observations
The week in Bitcoin.
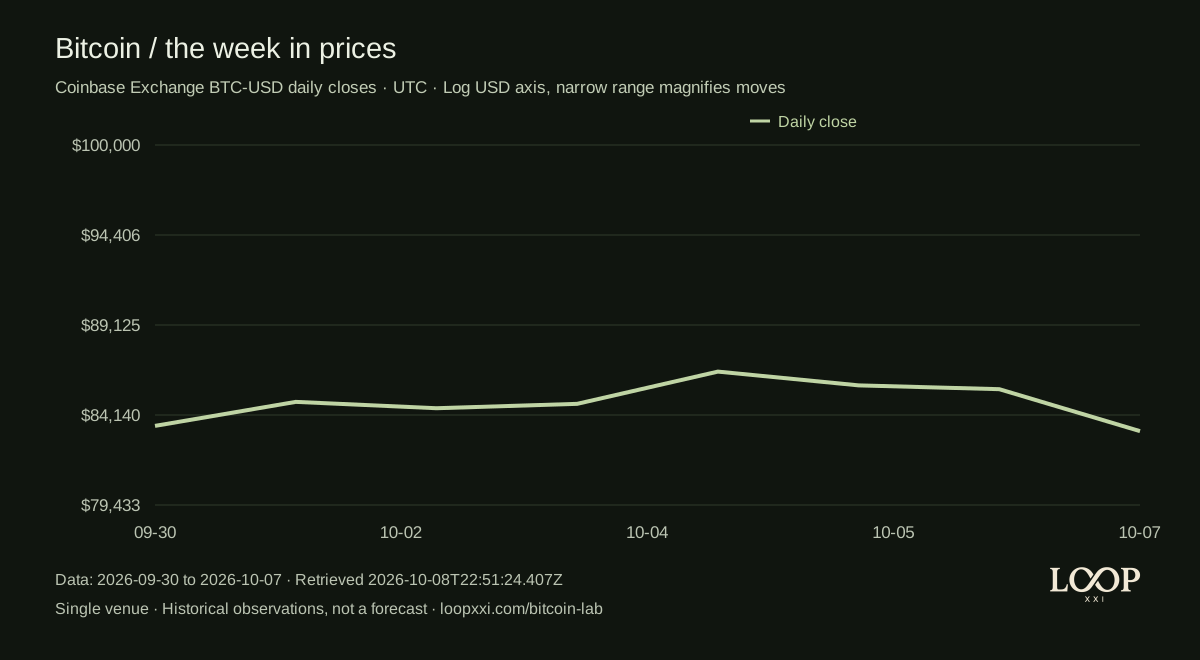
Snapshot dated 2026-10-08. Eight completed daily candles, seven close-to-close days. This page does not fetch a live price.
Latest completed close
$83,2752026-10-07, UTC daily bucket. Coinbase Exchange BTC-USD.
Seven-day change
-0.34%From 2026-09-30 close to 2026-10-07 close. No fees or income included.
Retrieval-time spot
$81,821Coinbase quote retrieved 2026-10-08T22:51:24.407Z. Different observation from the daily close.
Original Loop XXI rendering. Logarithmic USD axis; the tight vertical range magnifies a small weekly move. Single-venue observations can differ from an index. Past prices do not predict future returns.
Browse dated snapshots
- 2026-10-08: original chart (SVG) · observations (JSON)
Dated data and original charts are preserved. The main page shows the latest issue.
Read the underlying daily closes
| Date | Close (USD) |
|---|---|
| 2026-09-30 | 83556.14 |
| 2026-10-01 | 84848.73 |
| 2026-10-02 | 84504.88 |
| 2026-10-03 | 84742.22 |
| 2026-10-04 | 86507.11 |
| 2026-10-05 | 85748.96 |
| 2026-10-06 | 85539.77 |
| 2026-10-07 | 83275.06 |
02 / Assumptions
Change the shape.
Start with an invented $100,000 anchor. Compare three exponents. These are conditional paths, not a new statistical fit, price targets, floors, or probability ranges.
The default anchor is deliberately synthetic. Choosing a market quote anchors a scenario to that quote; it does not fit a historical trend.
Selected path at target
$1,275,752Conditional arithmetic only. Actual price may be far below every drawn line, including zero.
Interval annual growth
28.99%Compound annual growth between the two selected dates, not an expected return.
Local growth at target
20.53% / yearInstantaneous d ln(P) / dt. This is not the next year's finite percentage return.
Compare all three paths at the target date
| Path | Exponent | Target value (USD) |
|---|---|---|
| Lower exponent | 4.7 | 816,153.914974029 |
| Selected exponent | 5.7 | 1,275,751.61058065 |
| Higher exponent | 6.7 | 1,994,160.83417416 |
Outer paths use b minus one and b plus one, clipped to 0–10. They are a sensitivity comparison, not upper and lower limits. Exports include the inputs, model version, caveat, and Loop XXI wordmark. Animation is user-initiated and respects reduced-motion settings.
03 / Perspective
Check the denominator.
Respect the drawdown.
Two simple ways to see what headline returns leave out. Inputs are illustrative assumptions, not current macroeconomic readings.
04 / Methods, not mystique
What the model actually says.
The scenario is P(t) = P₀ × (t / t₀)^b. Both t and t₀ are positive elapsed days since January 3, 2009 at 00:00 UTC. P₀ is the chosen anchor price, not a fitted regression intercept. Using years instead of days leaves this ratio unchanged if both ages are converted consistently. Moving the origin does not.
A fixed exponent is not a fixed annual return. The instantaneous proportional rate is b / age_in_years; it declines as age increases. Finite-interval annual growth is (P_target / P₀)^(1 / elapsed_years) − 1. This lab defines a year as 365.2425 days.
We selected 5.7 for an educational comparison near published Bitcoin power-law estimates. We did not estimate it from the eight weekly-snapshot observations, and we do not import another author's intercept or uncertainty bands. A smooth curve is not evidence that Bitcoin must return to it.
What would make a forecasting claim credible?
A frozen model and data cutoff; a declared target horizon; comparison with simple alternatives; genuinely subsequent observations; and scored error and interval coverage. A high in-sample R² alone supplies none of these. Persistent residuals, changing market structure and selection of the origin or sample can undermine apparent precision.
The Baquero–Menezes working paper linked below explicitly distinguishes model-dependent ranges from calibrated prediction intervals. Its distant extensions are not evidence of future coverage. We deliberately do not reproduce its shaded “90% range” or fitted cycle.
Educational research only, not financial advice. Bitcoin is volatile and can suffer permanent loss. No curve here establishes fair value, a safe entry, a price floor or an investment recommendation.
Direct methodological references
Scientific Bitcoin Institute: power-law research, genesis-age formulation and published exponent estimates. Its methodology informs this discussion; this calculator is our original anchored scenario, not their fitted model.
Baquero & Menezes, 2026 working paper: model comparison, residual persistence and the limits of prediction ranges. Working-paper evidence is not peer-reviewed validation.
Data and reproducibility
Coinbase Exchange candle documentation. The downloadable JSON records the exact source request, candle observations, separate spot source and retrieval timestamp. No missing prices are invented or interpolated into the dataset.
Calculation source · Chart renderer · Deterministic tests. Model version lab-1.1.0. Original chart design and rendering by Loop XXI.