

Bitcoin and liquidity: what the data can tell us
Three public series stand behind the word liquidity. Each answers a different question. The one comparison that needs no price: dollars grow by decision, bitcoin by schedule.
Read the 1:15 film transcript
English transcript from the film captions. Educational commentary with synthetic narration.
When people say that Bitcoin follows liquidity, they usually mean one of three things that are actually measured.
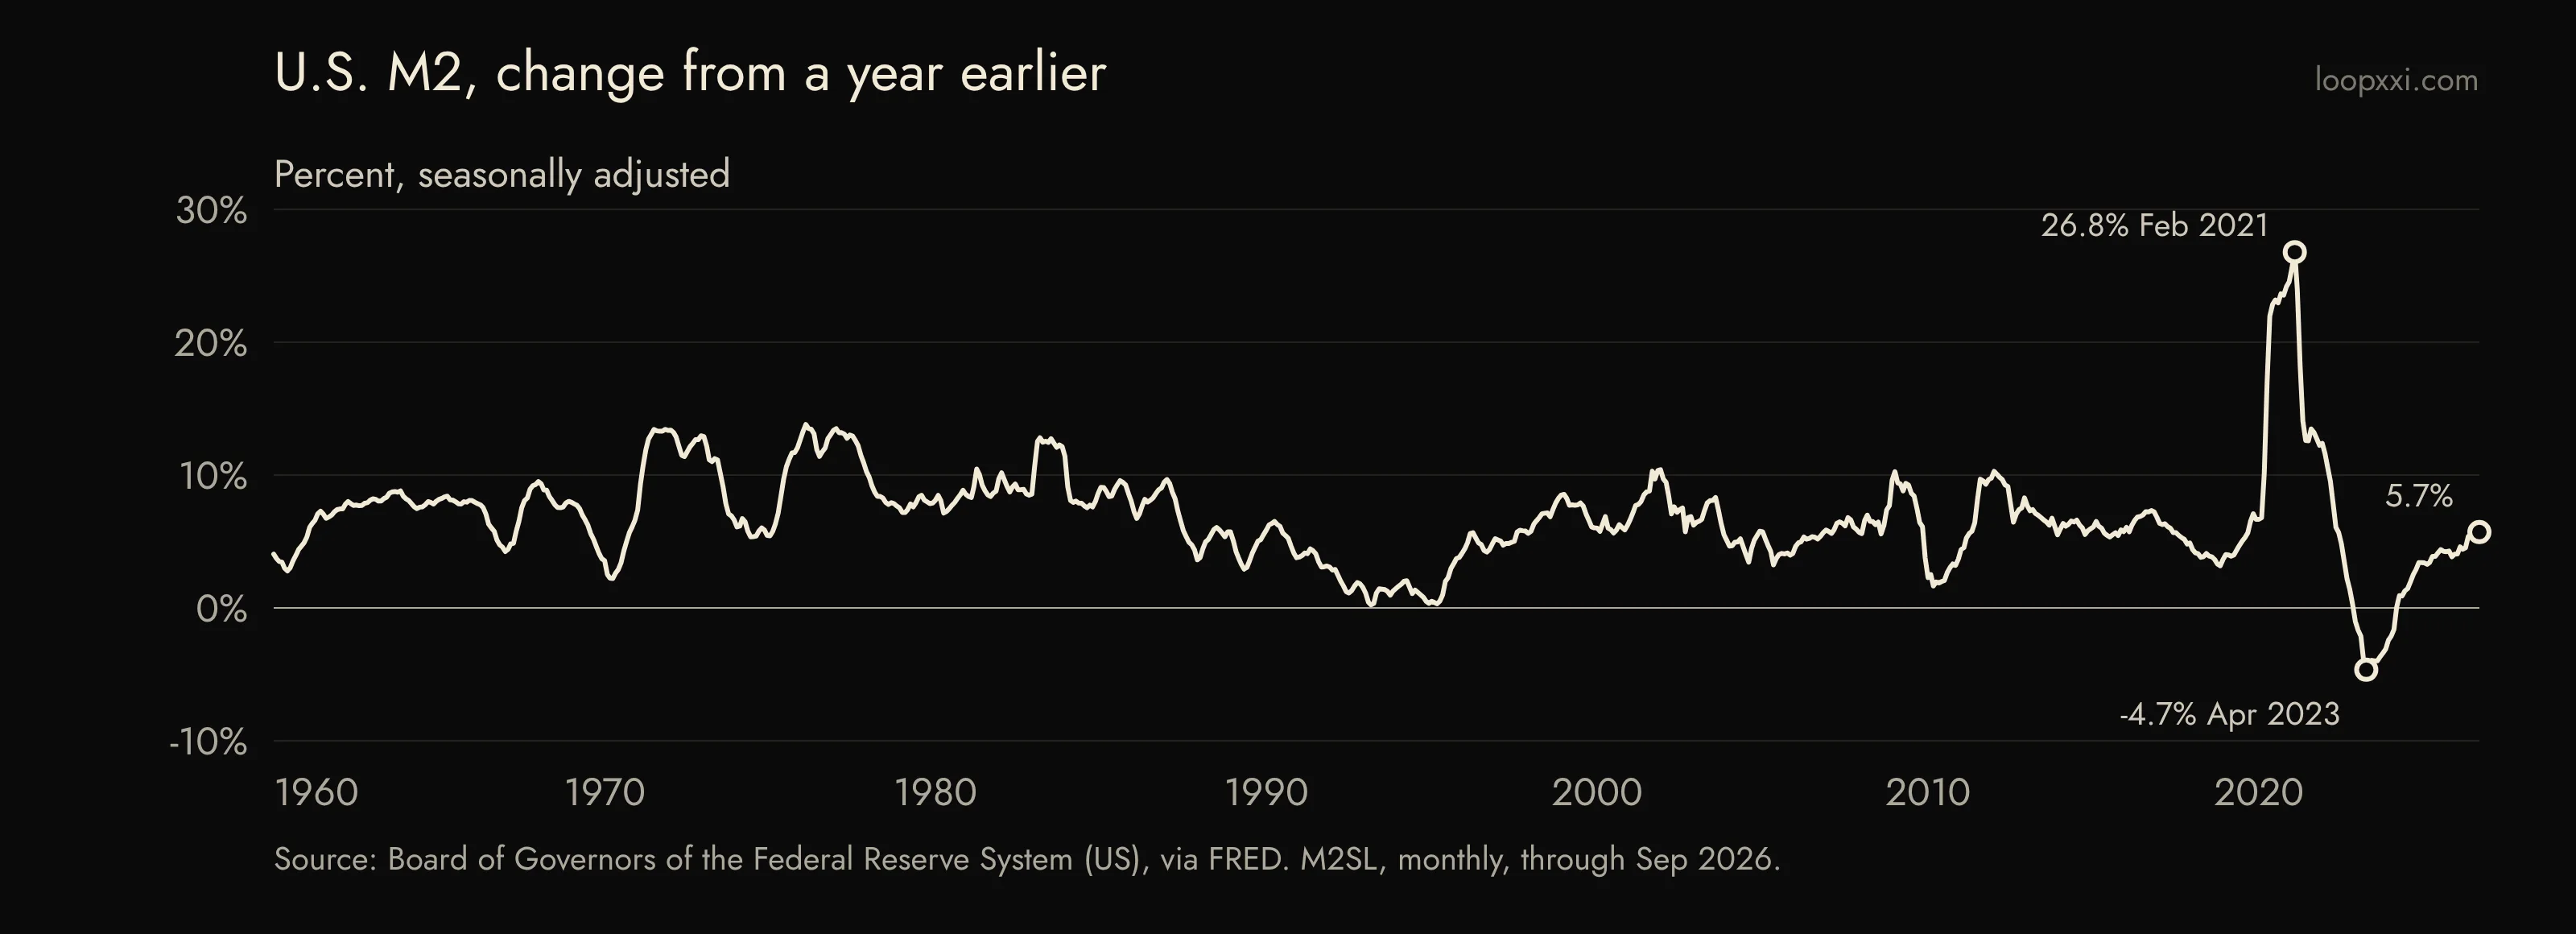
The first is M2: the dollars that households and businesses hold in a form they can spend.
For six decades it grew between zero and fourteen percent a year.
In early 2021 it grew twenty-seven percent. Two years later, it was shrinking.
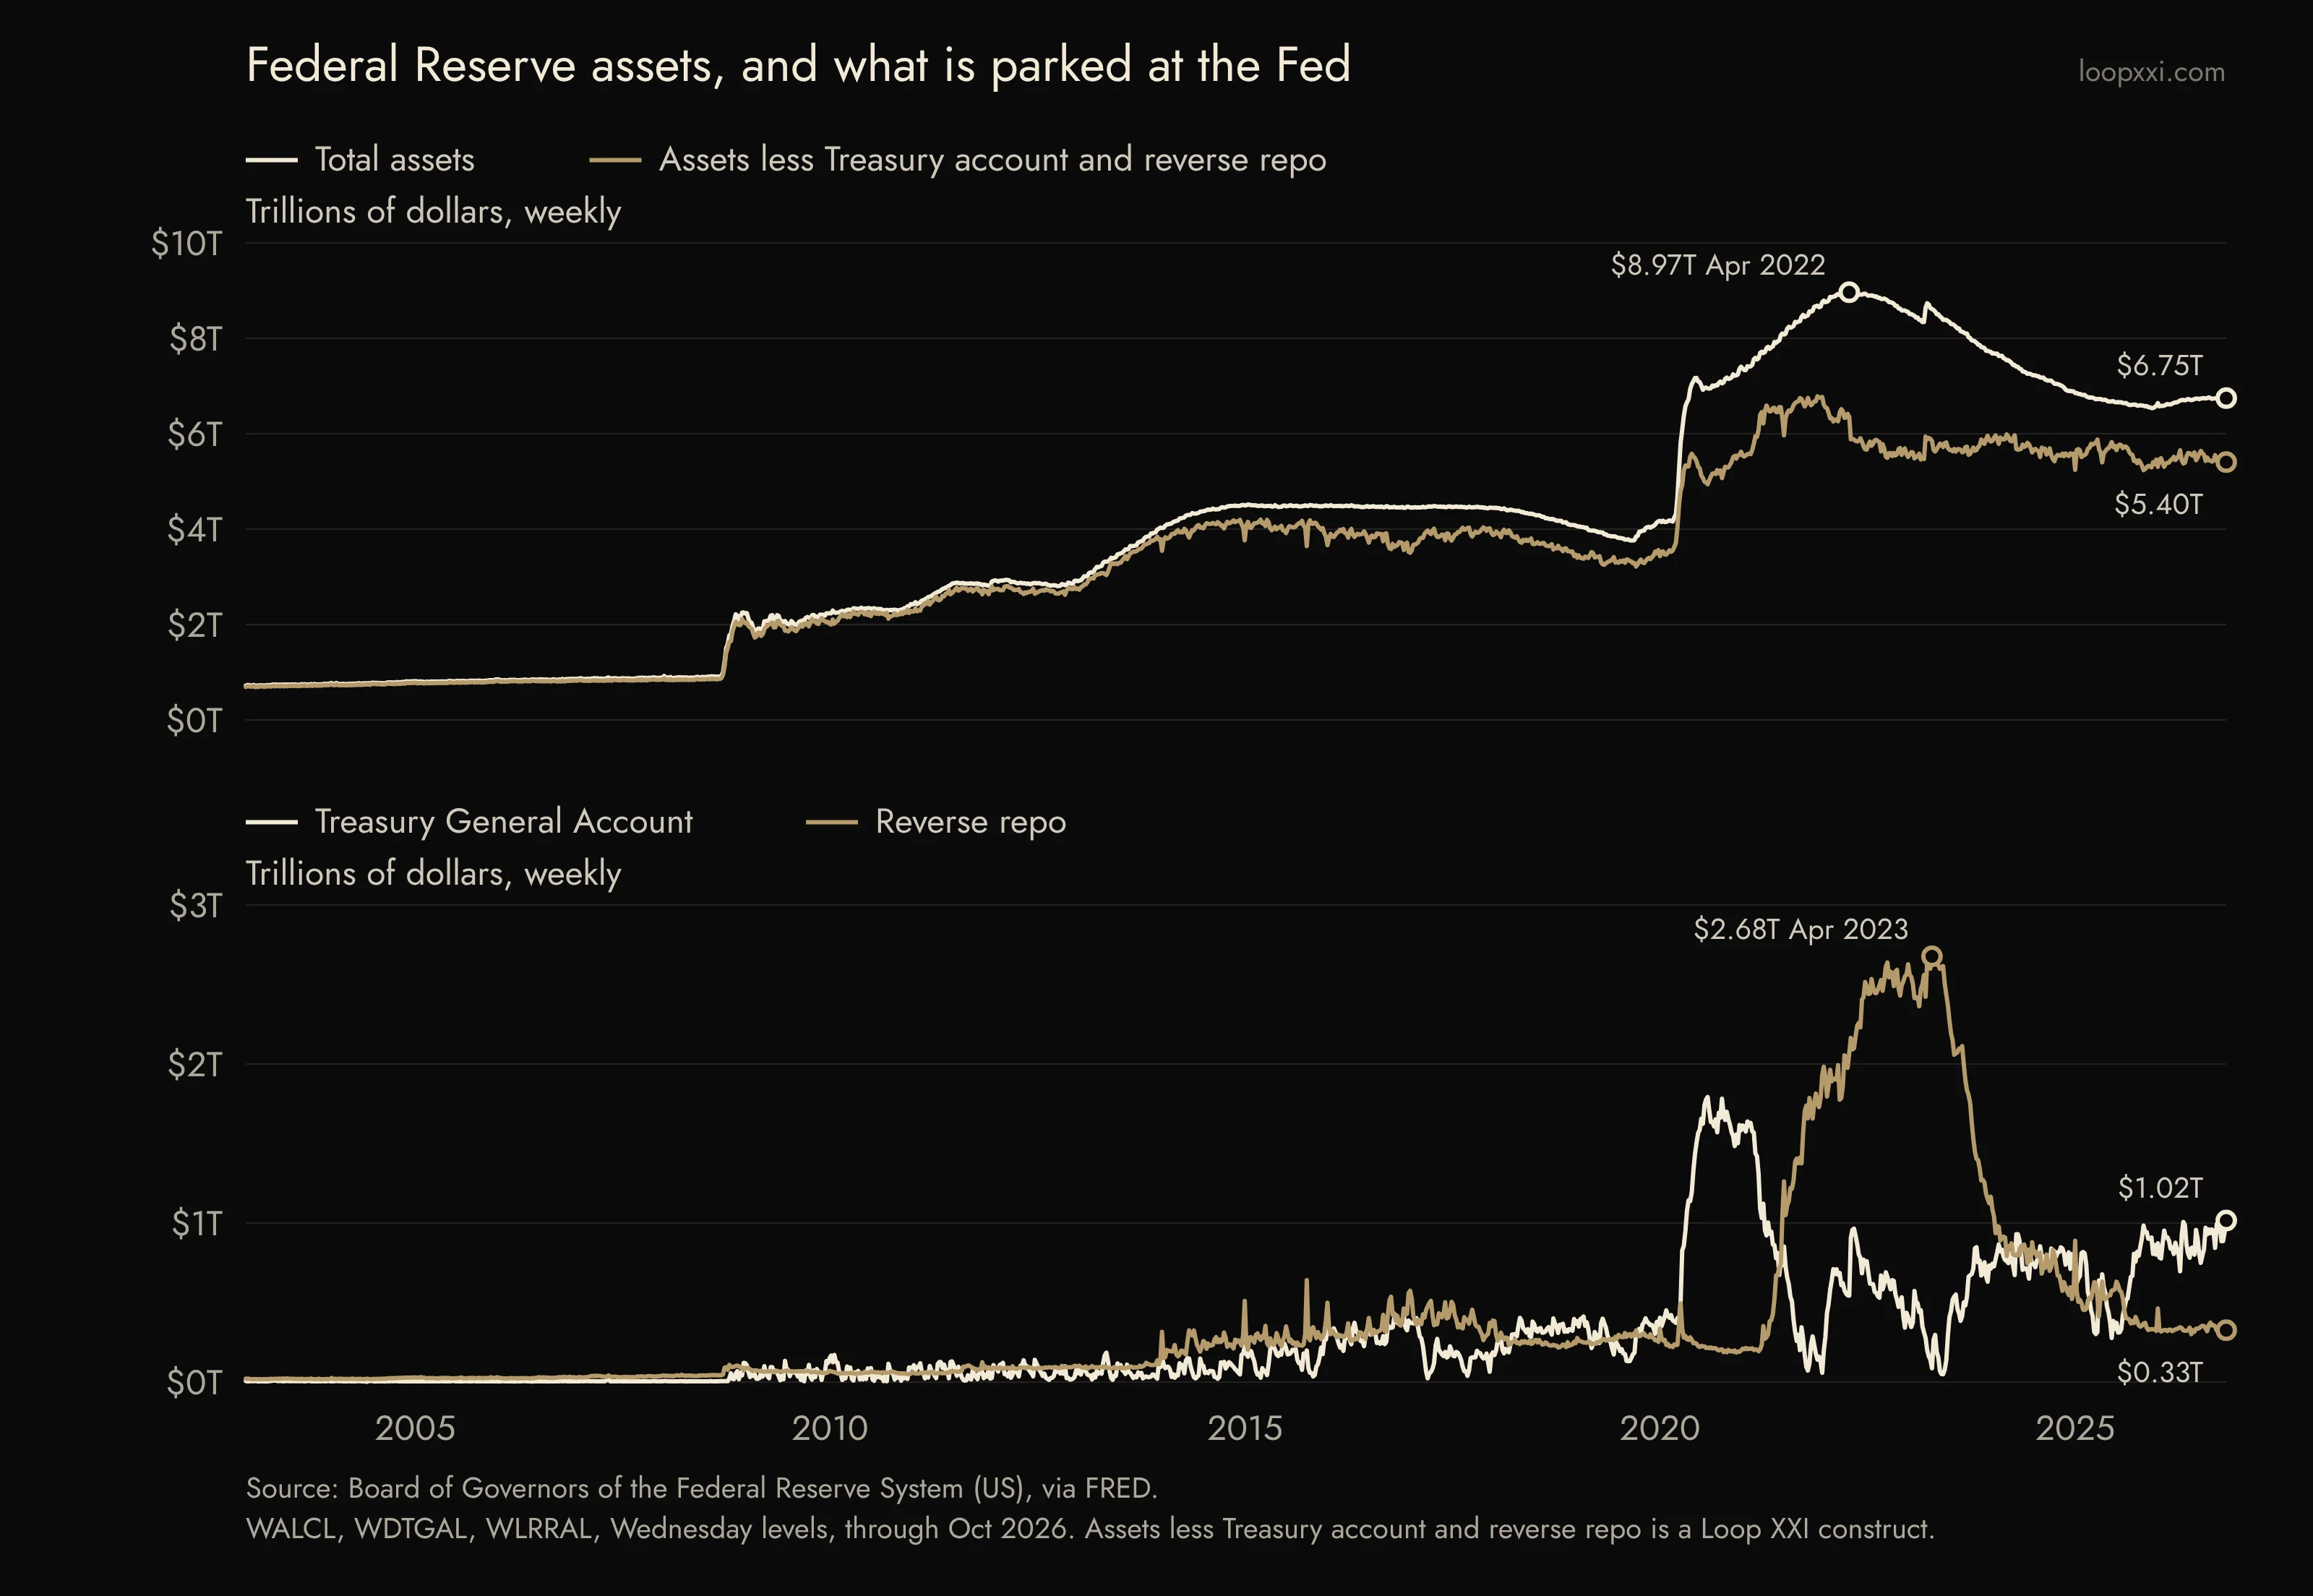
The second is the Federal Reserve's balance sheet. It peaked near nine trillion dollars in 2022.
But part of it sits parked at the Fed, in the Treasury's account and in overnight reverse repo.
Subtract those, and what reaches the banking system is smaller than the headline.
The third is bitcoin's own supply. Nobody decides it.
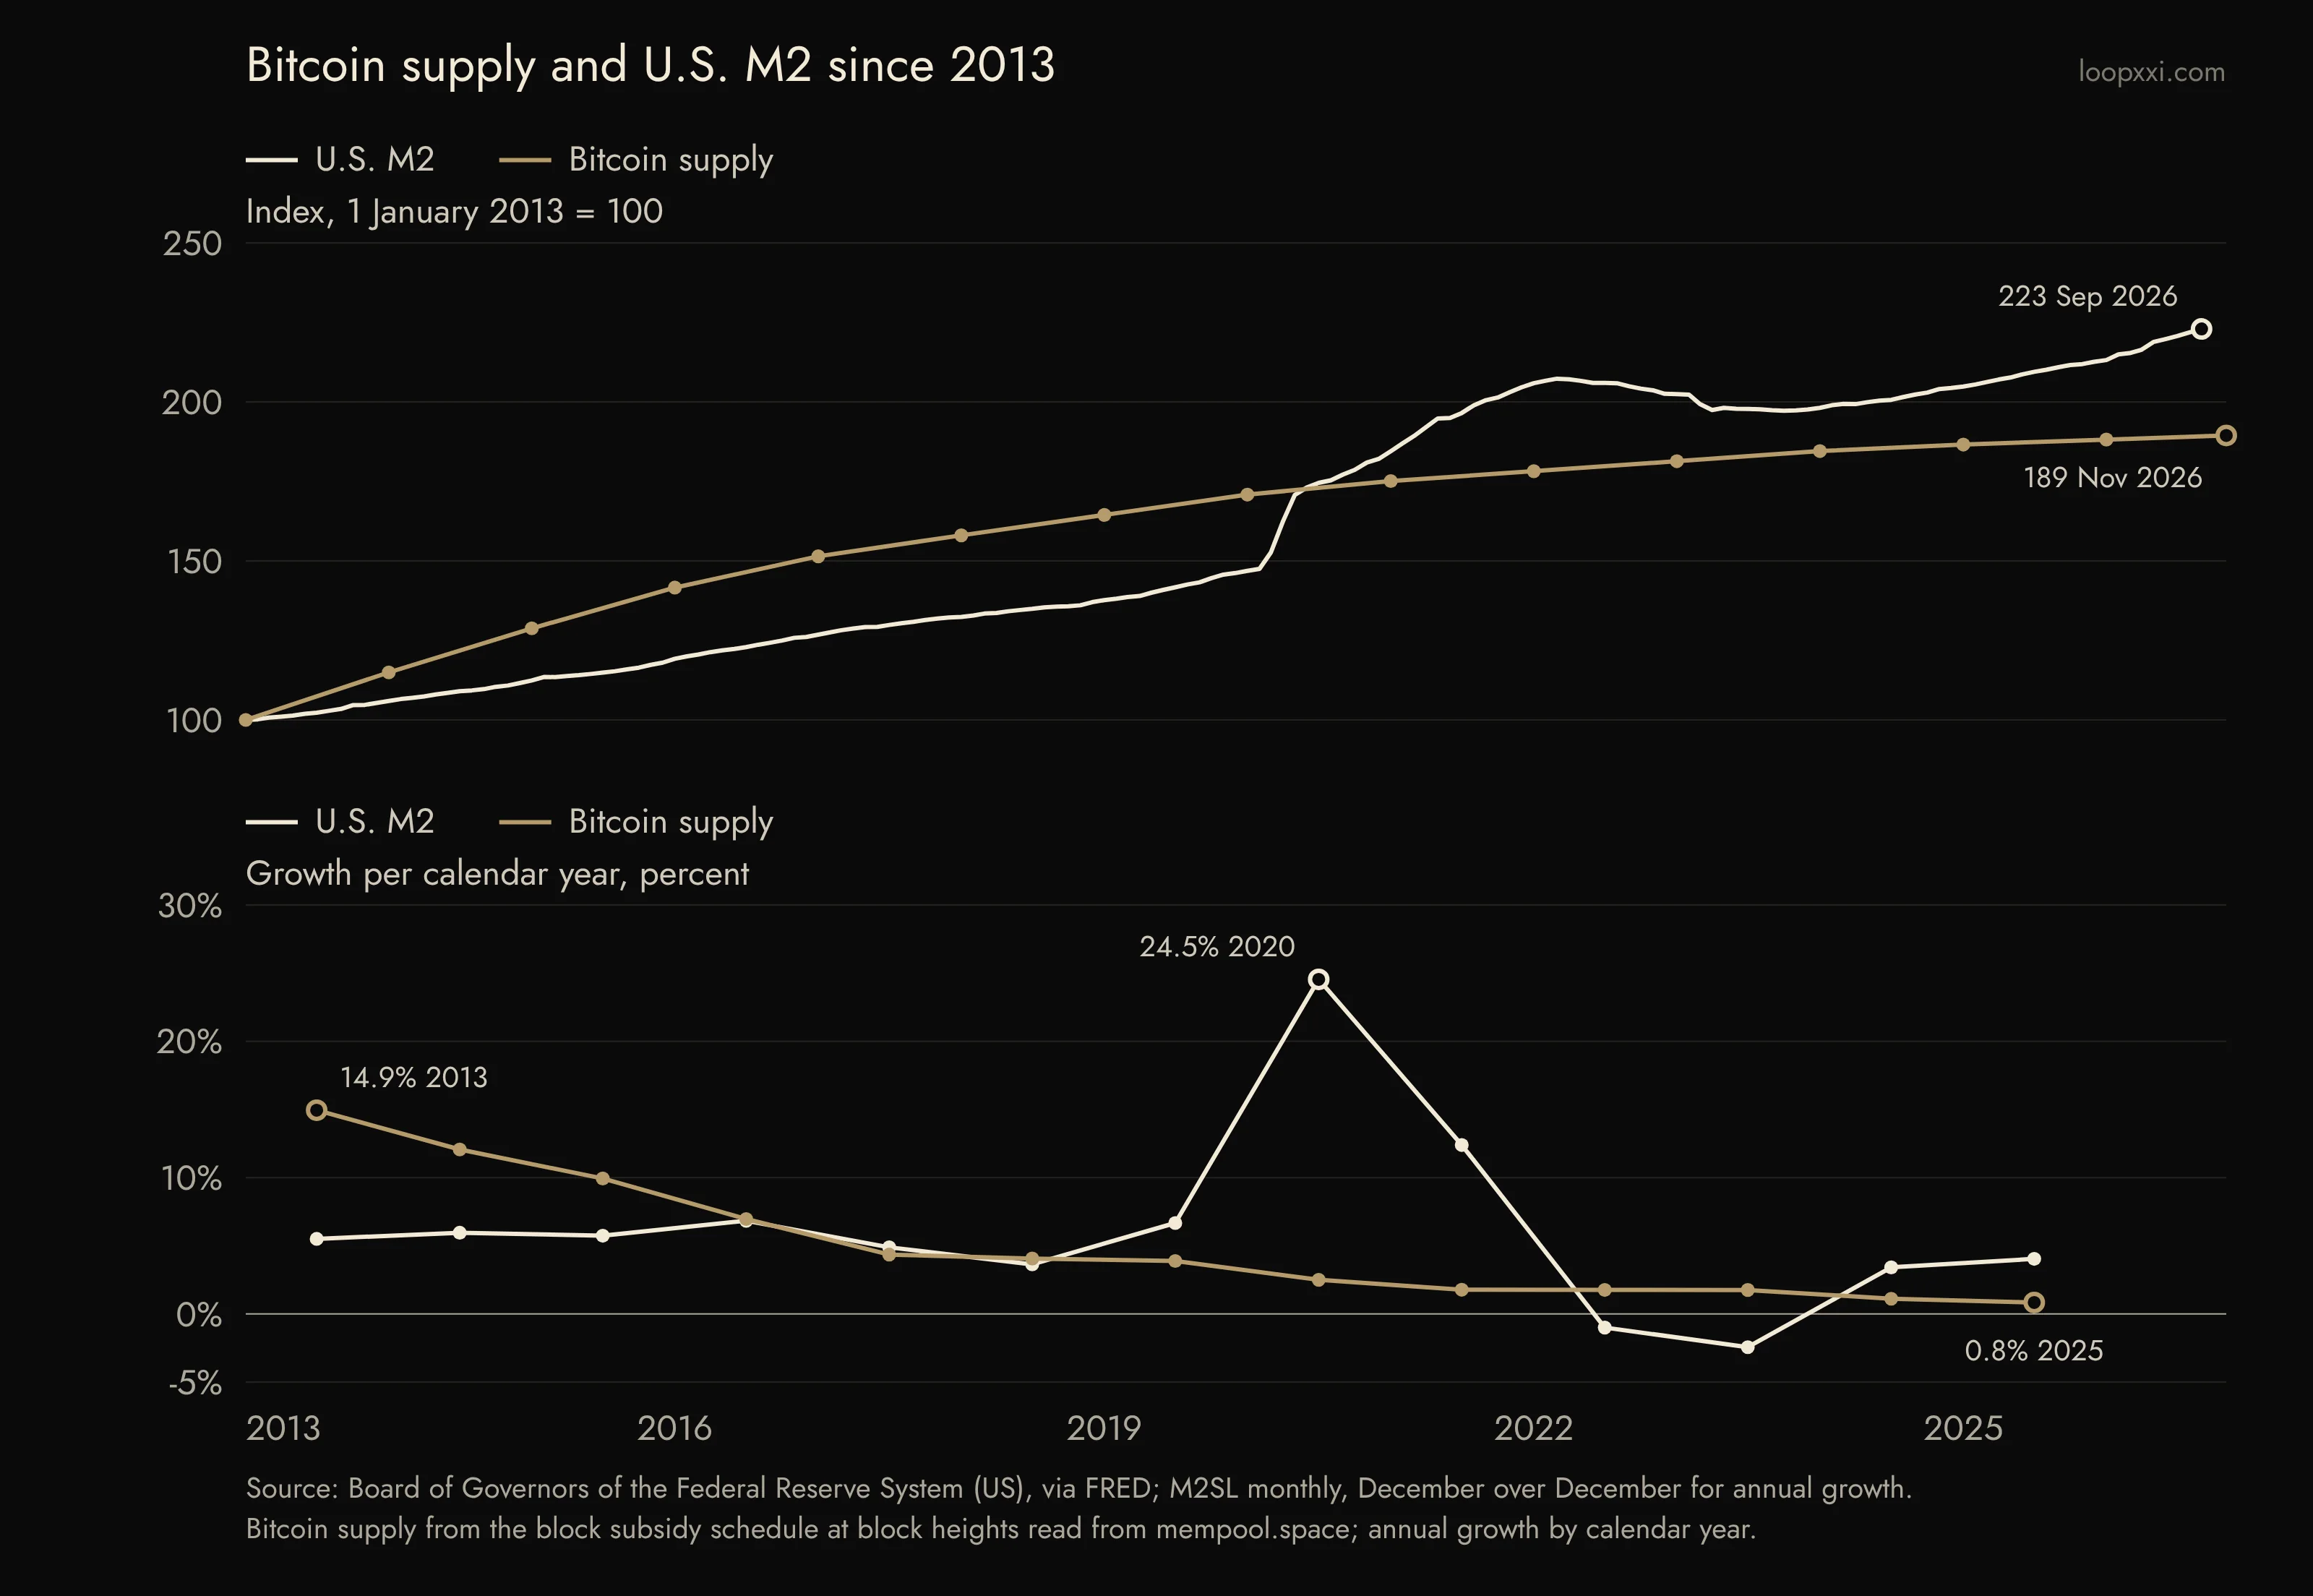
The block subsidy halves every 210,000 blocks, so supply growth falls on a schedule: fifteen percent in 2013, under one percent in 2025.
Since 2013, more dollars were added, in percent, than bitcoin.
But one rate was decided. The other was computed in advance.
That is what the data can tell us. It cannot tell us a price, and it cannot tell us a cause.
The full record, with every number and formula, is on loopxxi.com.
Three things people mean by liquidity
When someone says that Bitcoin follows liquidity, they usually mean one of three measured things: the money the public holds, the size of the central bank's balance sheet, or the supply of the asset itself. Each is a public series. Each answers a different question. The charts below show all three as published, with the source and the formula under each one.
One thing this piece does not show is a Bitcoin price. We publish only data we have the right to publish, and the price feeds we checked require a licence or written permission to reproduce. Every chart here is built from series in the public domain and from the Bitcoin chain itself. The research record linked at the end has every number, hash and formula.
Money held by the public
M2 counts the dollars that households and businesses hold in a form they can spend: cash, checking and savings deposits, small time deposits and retail money market funds. The Federal Reserve publishes it monthly in the H.6 release. The chart shows how fast that stock grew compared with the same month a year earlier.
For six decades the growth rate stayed between roughly zero and 14 percent. In 2020 and 2021 it left that range: 26.8 percent in February 2021, the fastest in the series. Then came the first contraction in the series. M2 was below its level of a year earlier for fifteen months, from December 2022 to February 2024, with a low of minus 4.7 percent in April 2023. In September 2026 it was growing at 5.7 percent.
What the series can tell you: how fast the stock of spendable dollars is growing, and whether that is unusual. What it cannot: who holds the dollars, whether they are being spent, or where they go next. It is also a United States aggregate. It is sometimes called global liquidity. It is not.
The Fed's balance sheet, and what is parked at the Fed
The second series is the size of the Federal Reserve's balance sheet: total assets, published every Thursday for the Wednesday before in the H.4.1 release. It was under one trillion dollars before 2008, about 4.5 trillion by 2015, and peaked at 8.97 trillion in April 2022. On 28 October 2026 it stood at 6.75 trillion.
The headline number overstates what reaches banks and markets on a given day, because two large accounts sit on the other side of the same balance sheet. The Treasury General Account is the federal government's checking account at the Fed. Reverse repo is cash that money market funds and others lend to the Fed overnight. Money in either account is parked at the Fed; it is not in the banking system that day.
The bottom panel shows both. Reverse repo peaked at 2.68 trillion dollars in April 2023 and has since drained to 0.33 trillion. The Treasury account was 1.02 trillion in the latest week. The second line in the top panel subtracts both accounts from total assets. That line is our own construct for this chart, not a Federal Reserve measure of reserves, and it stood at 5.40 trillion. The gap between the two lines is the money parked.
What these series can tell you: the direction and size of the balance sheet, and how much of it is idle at the Fed on a given Wednesday. What they cannot: anything about an asset price. A balance sheet is an inventory, not a flow into any market.
Bitcoin's supply grows by schedule
The third series is the supply of bitcoin, and it is the only one of the three that is not set by anyone. Each block pays its miner a subsidy: 50 bitcoin at the start, halved every 210,000 blocks. The four halvings so far came at blocks 210,000 in November 2012, 420,000 in July 2016, 630,000 in May 2020 and 840,000 in April 2024. At block 974,318 on 3 November 2026 the scheduled supply was 20,107,247 bitcoin. The coins actually spendable are slightly fewer, because a few blocks claimed less than their full subsidy and some coins are lost.
The top panel puts both supplies on one index, 100 on 1 January 2013. By September 2026, M2 had reached 223. By November 2026, bitcoin's supply had reached 189. In percent, more dollars were added over this window than bitcoin. The shapes differ more than the totals: the dollar line bends with decisions in 2020, and bitcoin's line flattens after each halving.
The bottom panel shows growth per calendar year. Bitcoin's supply grew 14.9 percent in 2013 and 0.8 percent in 2025, every year lower than the one before. M2 grew between minus 2.4 percent in 2023 and 24.5 percent in 2020. Through 2016, bitcoin's supply grew faster than M2 every year. From 2017 on, it grew more slowly in six of nine years; the exceptions were 2018 and the two years when M2 shrank.
What this comparison can tell you: how the two supplies have grown, and that one of them follows a published rule. It is the one comparison in this piece that needs no price. What it cannot: whether either growth rate matters for what a bitcoin or a dollar buys. Supply is half of a price. The other half is demand, and no chart here measures it.
What the data cannot tell us
None of these charts shows a cause. Two lines that rise together are two lines that rise together. None of them is a forecast; a chart of history is a record, not a model, and nothing here is fitted to a curve.
The series are revised. M2 arrives about four weeks after the month it describes, and both M2 and the balance sheet are restated when the Fed changes a definition or a seasonal factor. The numbers above are the values published on 3 November 2026. A later reading can differ, and the record keeps the raw files and their hashes so the difference can be measured.
The honest version of the liquidity story is narrower than the popular one. The dollar supply grows at a rate someone decides, and that rate moved from about 27 percent to about minus 5 percent in just over two years. Bitcoin's supply grows at a rate everyone can compute in advance, and that rate is now under one percent a year. That is what the data can tell us. What the two facts are worth to you is a question for your own balance sheet, not for a chart.
Sources
- FRED: M2 (M2SL), Board of Governors of the Federal Reserve System ↗
- FRED: Total assets, Wednesday level (WALCL) ↗
- FRED: U.S. Treasury General Account, Wednesday level (WDTGAL) ↗
- FRED: Reverse repurchase agreements, Wednesday level (WLRRAL) ↗
- Federal Reserve: H.6 Money Stock Measures ↗
- Federal Reserve: H.4.1 Factors Affecting Reserve Balances ↗
- mempool.space: block 840000, the fourth halving ↗
- Loop XXI research record: data, formulas, hashes and rebuild script ↗
Educational commentary from Loop XXI. Publication record: Block 974,334.