

The gap between pay and money: prices, houses and Bitcoin since 1964
Since 1964 the dollar supply grew 59-fold, house prices 21-fold, hourly pay 13-fold and consumer prices 11-fold. The gap between a paycheck and the money supply is the story of the last sixty years. Bitcoin is the first money whose supply no one can expand to close it.
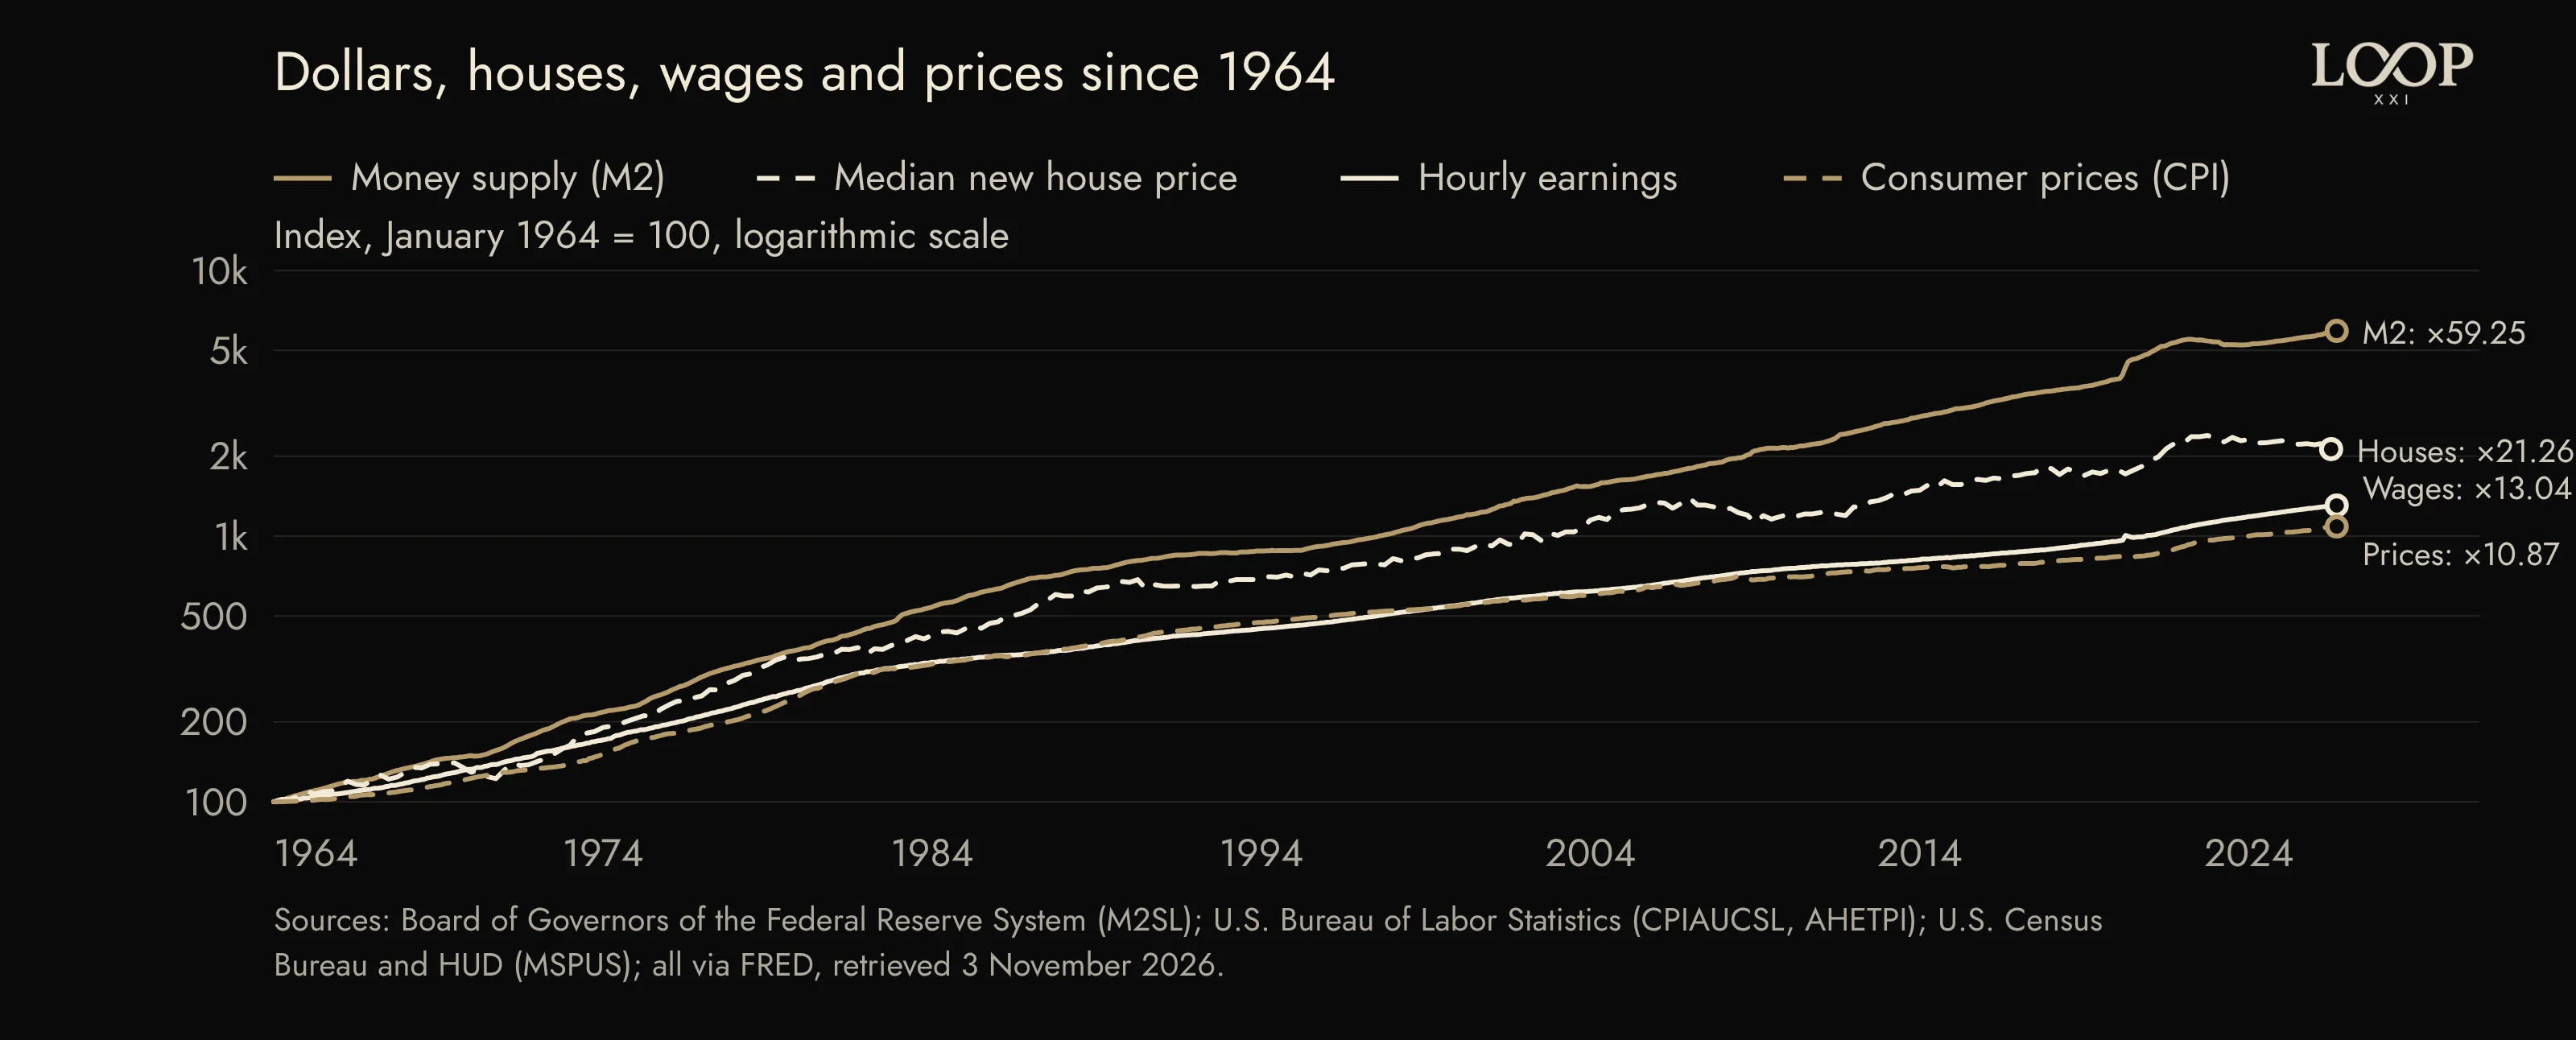
Four lines, one direction
Take four public series and set each to 100 in January 1964. M2, the broad measure of dollars in circulation, stands at 5,925 in September 2026. The median price of a new house stands at 2,126. Average hourly earnings of production and nonsupervisory workers stand at 1,304. Consumer prices stand at 1,087. In plain multiples: dollars 59 times, houses 21 times, pay 13 times, prices 11 times.
The order matters more than the exact numbers. The money supply grew fastest. Houses, which people buy with borrowed money, grew next. Pay grew about as fast as prices, with a little to spare. Pay kept pace with roughly a fifth of the growth in dollars. That is the gap in the title.
What an hour of work buys
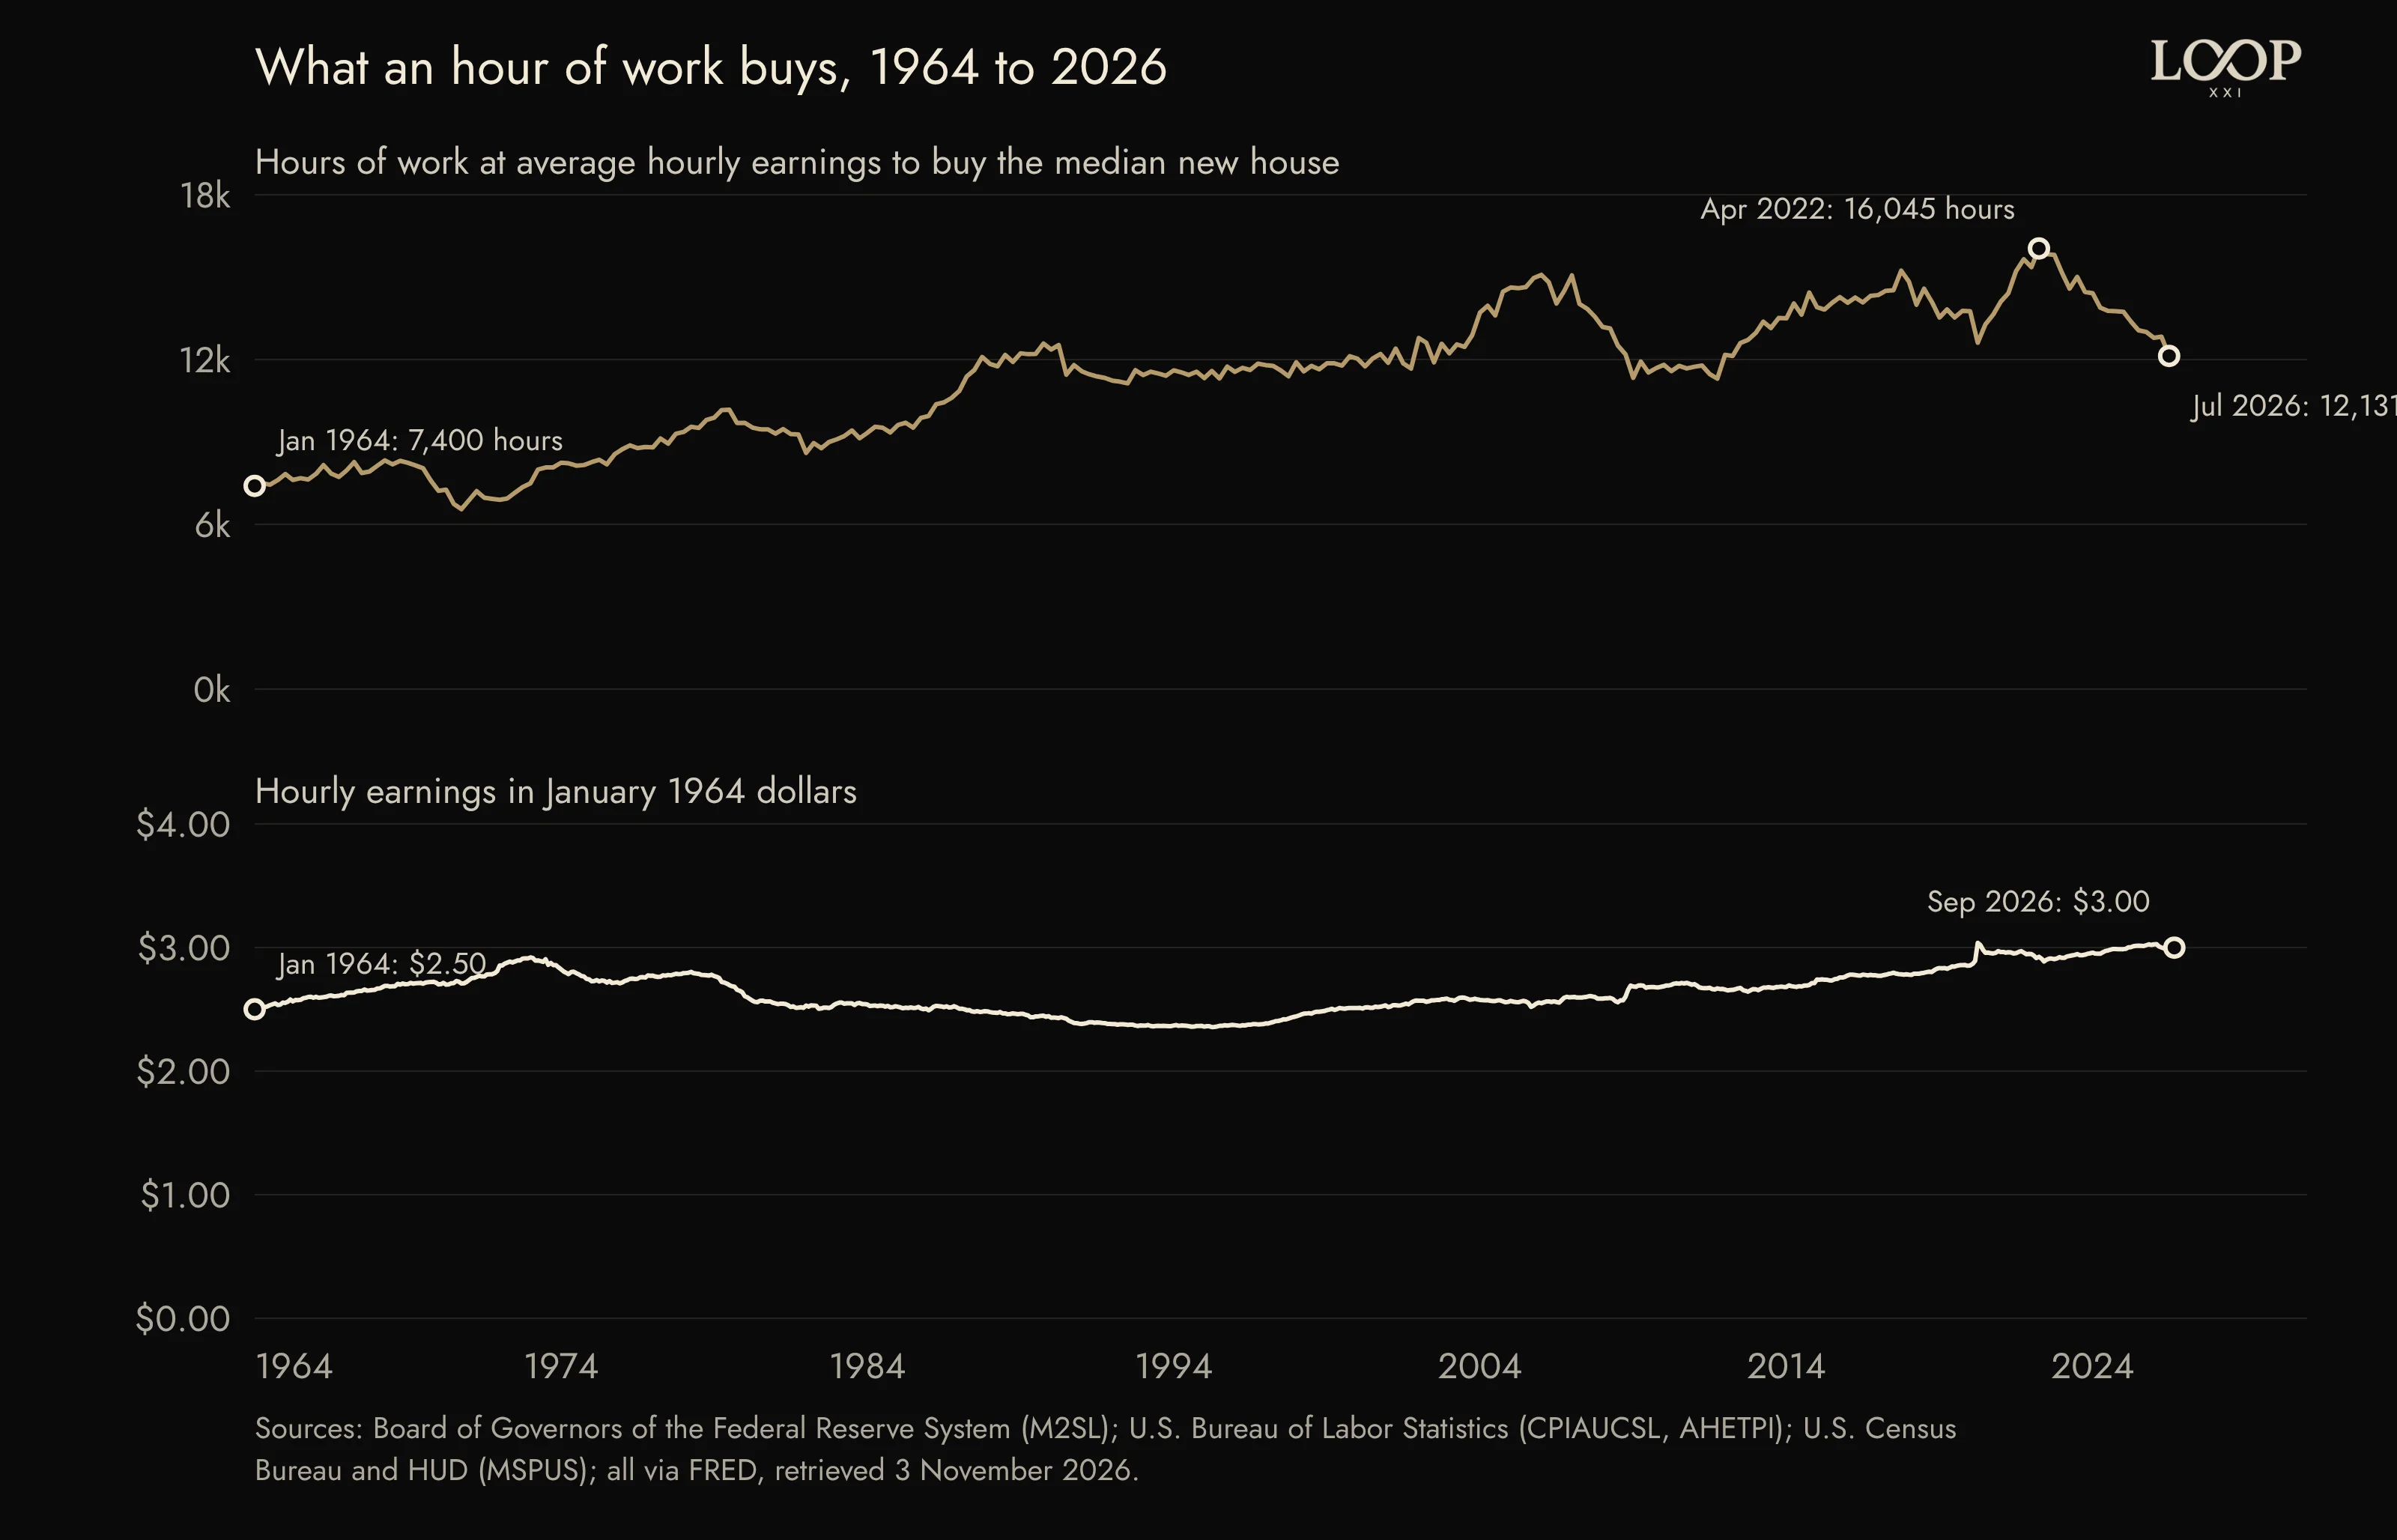
Index charts hide the thing a worker feels. Divide the median new house price by average hourly earnings and you get the hours of work a house costs. In January 1964 it was 7,400 hours, about three and a half years of full-time work. In the third quarter of 2026 it is 12,131 hours, about six years. The peak was 16,045 hours in the spring of 2022.
Measured in consumer prices, pay did better than it feels. An hour of production work bought $2.50 of goods in January 1964 money. In September 2026 it buys $3.00 in the same money. That is a 20 percent gain in 62 years, with a long dip from the early 1970s to the mid-1990s. The things a worker most wants to own, a house first, rose faster than the basket used to measure prices.
Gold and stocks
International Man's November 2026 piece on the wealth divide makes the same comparison and adds two assets. By its count, gold and the S&P 500 both beat the money supply since 1964, and only those two did. We have not drawn them here. The public-domain series we publish from do not include gold or stock prices, and we do not chart data we cannot license. The direction of its figures agrees with ours: the money supply is the hurdle, and only scarce assets cleared it.
That is the first lesson of the chart. A wage earner who saves in dollars is measured against a supply that grew 59-fold. A saver who holds something scarce is measured against the same supply and can keep up. Housing kept up in part; its price carries borrowed money, so it tracks credit as much as scarcity.
Why the gap keeps opening
A government that spends more than it collects has three choices: tax, borrow or issue. Issuing is the quiet one. New dollars reach the system through the banks and the bond market first, then through asset prices, and reach wages last. By the time a raise arrives, the house it was meant to buy has moved. This is not a theory about intentions. It is the order in which the four lines above move.
Nothing in the chart suggests the order will reverse. Spending commitments are set years ahead, and the supply of dollars is a decision taken by people who answer for the next quarter. A worker has no vote on that decision and no way to hold a dollar that is exempt from it.
Where Bitcoin fits
Bitcoin is the first widely held money whose supply follows a schedule no one can change. The schedule is public, and we charted it against M2 in an earlier piece: bitcoin's supply grew 0.8 percent in 2025, the dollar supply grew by decision. That is the property a wage earner has never had: a unit that cannot be issued to fund someone else's spending.
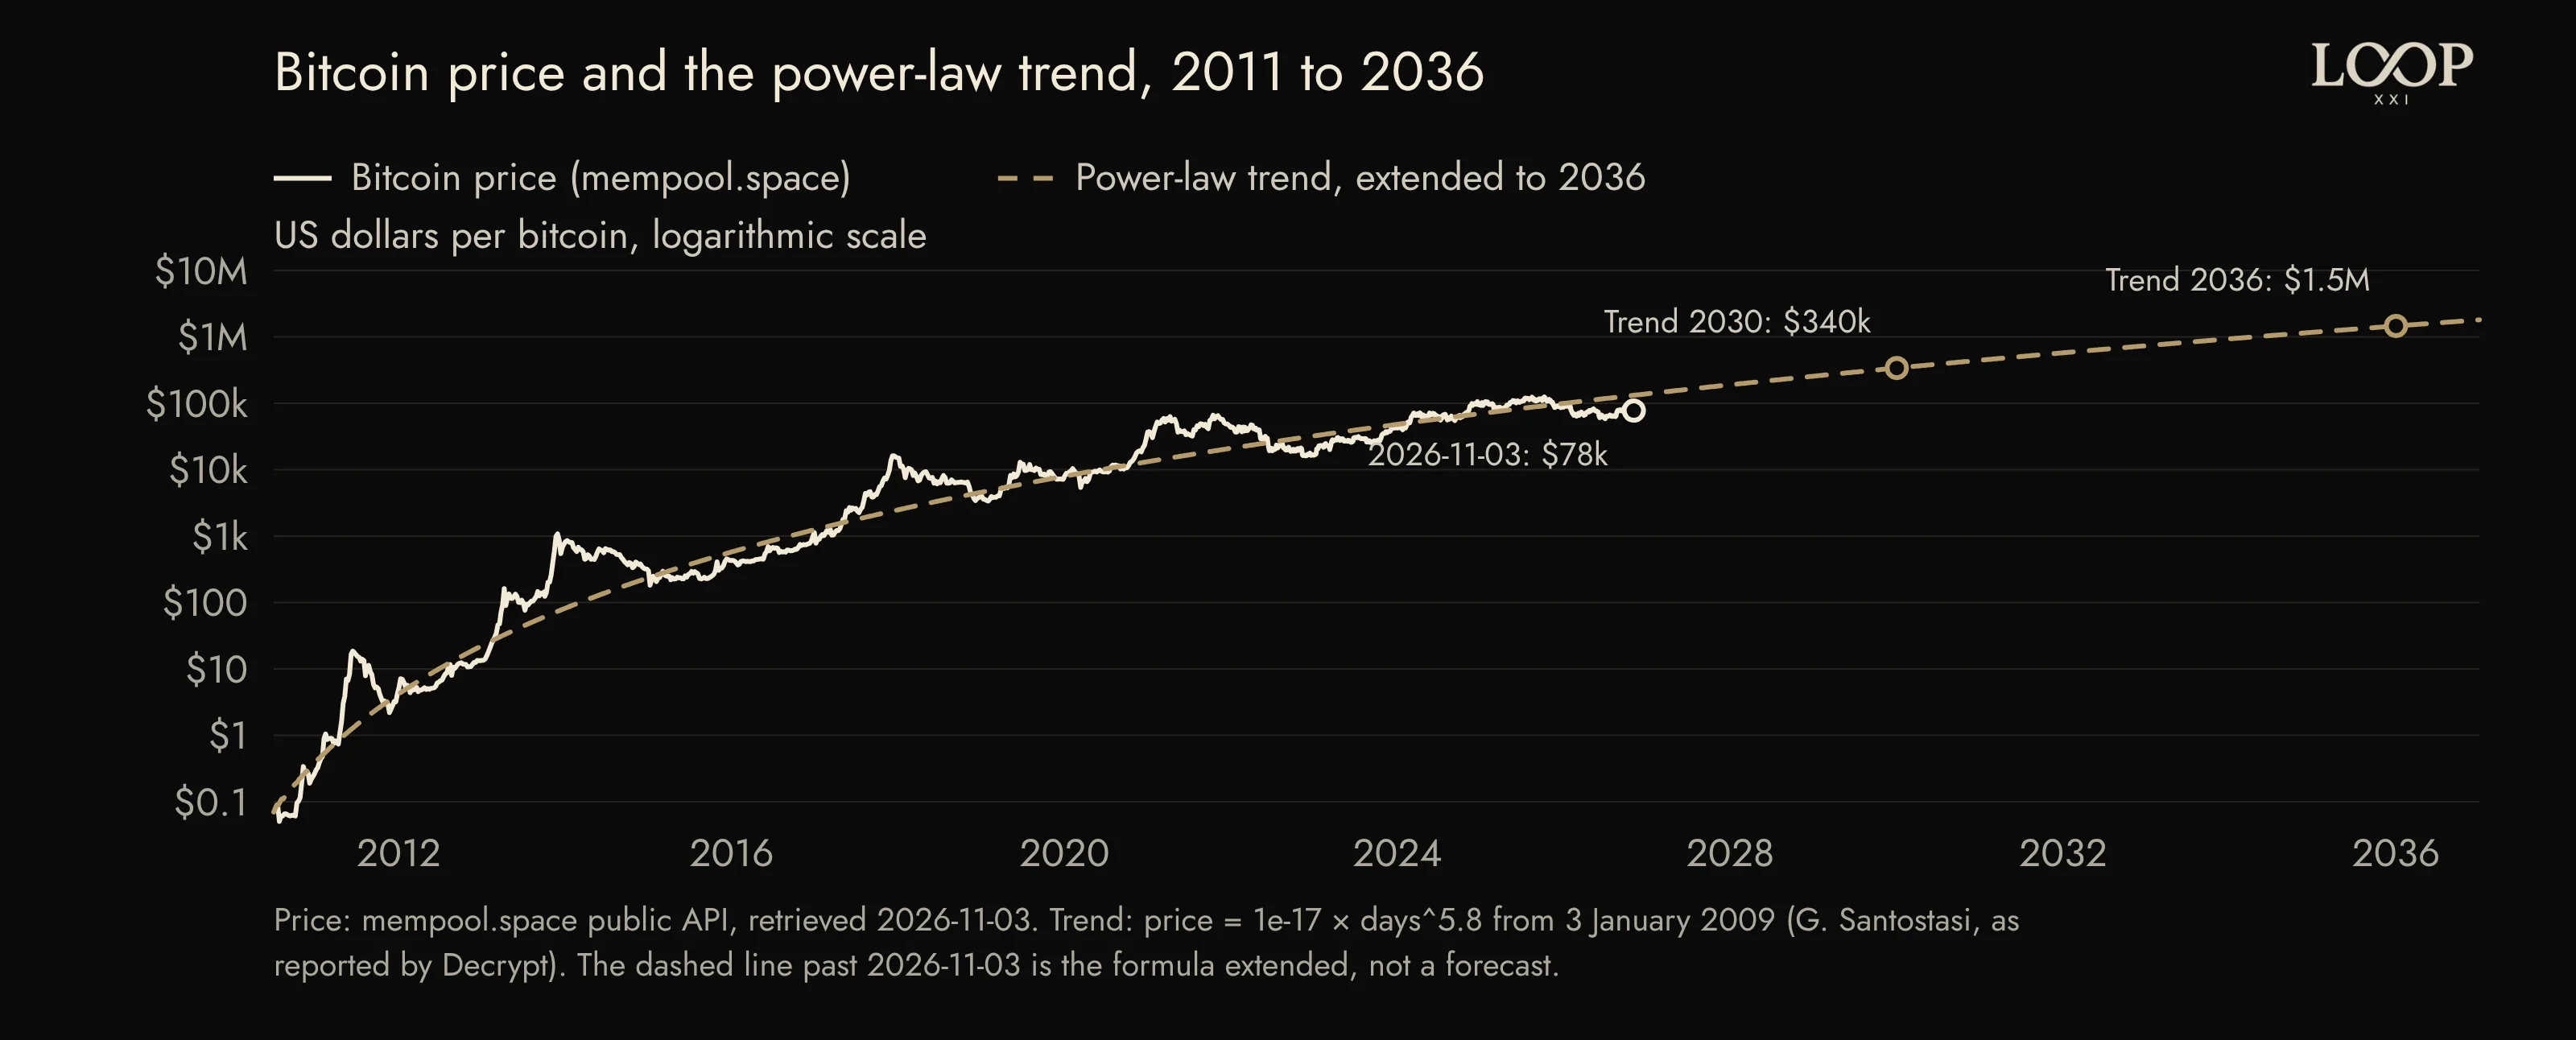
Its price has been volatile, and the chart below does not hide that. Since 2011 the dollar price has risen from under a dollar to $77,506 on 3 November 2026, with drawdowns of more than 70 percent along the way. Through the swings it has tracked a power law in time: price equals ten to the minus seventeen times the number of days since the first block, raised to the power 5.8. That is a fit proposed by the physicist Giovanni Santostasi, not a law of nature, and the dashed line past today is the formula carried forward, not a forecast. Read that way, the trend passes $131,897 today, $339,747 at the start of 2030 and $1,459,589 at the start of 2036. The price today sits at 0.59 of the trend, inside the band where it has spent most of its history.
Why a decentralized currency matters for wages
The gap in the first chart is not a market outcome. It is the result of one party holding the right to issue the unit everyone else is paid in. Every expansion of the supply is a transfer from people who hold the unit to people who receive the new units first, and wage earners hold the unit by definition. A currency with no issuer removes that right from everyone, including governments that mean well.
That is the case for a decentralized money, and it is a case about fairness before it is a case about returns. Pay priced in a unit that cannot be expanded is pay that cannot be diluted. Savings held in it are measured against a known supply, not against next year's decision. Whether bitcoin is the unit that wins is a question the next sixty years will answer. The property it has today, a fixed schedule with no one to petition, is the property the four lines above say a wage earner needs.
What this is not
It is not investment advice. Loop XXI does not recommend investments or manage anyone's money. Bitcoin's price can fall by more than half in a year and has done so several times.
The data have edges. The house series is the median new house, not all houses. The pay series covers production and nonsupervisory workers, not all employees. The consumer price index is one basket, and reasonable people argue about what it leaves out; we use it as published. The power law is a fit to past prices, and a fit can fail. Every number here derives from the committed data in the research record, which lists the formulas, the raw hashes and a rebuild script.
Sources
- FRED: M2 (M2SL), Board of Governors of the Federal Reserve System ↗
- FRED: Consumer Price Index for All Urban Consumers, All Items (CPIAUCSL), U.S. Bureau of Labor Statistics ↗
- FRED: Average Hourly Earnings of Production and Nonsupervisory Employees, Total Private (AHETPI), U.S. Bureau of Labor Statistics ↗
- FRED: Median Sales Price of New Houses Sold for the United States (MSPUS), U.S. Census Bureau and HUD ↗
- mempool.space: historical Bitcoin price API ↗
- Decrypt: The Bitcoin power law, a mathematical approach to predicting Bitcoin's price (Santostasi) ↗
- International Man: The great wealth divide, own the right assets or fall behind (Nick Giambruno, November 2026) ↗
- Loop XXI: Bitcoin and liquidity, what the data can tell us ↗
- Loop XXI research record: data, formulas, hashes and rebuild script ↗
Educational commentary from Loop XXI. Publication record: Block 974,428.